How to Measure Event Marketing Success: KPIs, ROI, and Reporting

Ida
Content Contributor, HeySummit
Event marketing success is performance against a goal you defined before the event. A useful measurement plan names the goal, baseline, target, cost, owner, data source, and decision window. No single registration, attendance, engagement, or revenue number proves success for every event.
Start with the decision the event needs to inform. Then choose the smallest set of metrics that can support that decision. This guide shows how to connect campaign attribution, event data, direct financial return, and longer-term value without forcing them into one misleading score.
What does event marketing success mean?
Event marketing uses an event to create a specific audience or business outcome. Success is not simply having a busy event, a large registration list, or a positive survey. It is evidence that the event moved an agreed goal far enough to justify what it cost and to guide the next decision.
That goal may be financial, but it does not have to be. A paid summit might prioritize net event revenue. A free webinar might prioritize qualified sales conversations. A community event might prioritize participation and repeat attendance. A customer-education event might prioritize completion, adoption, or reduced support demand. The metric should follow the job.
Keep four types of value separate:
- Direct financial return: attributable ticket, sponsor, replay, upgrade, donation, or follow-up revenue, less the costs required to create and deliver the event.
- Influenced commercial value: qualified leads, pipeline, sales conversations, renewals, or later purchases that the event may have influenced but did not produce as a directly traceable transaction.
- Audience and learning value: reach, registrations, attendance, engagement, feedback, audience growth, content performance, and evidence about topics or offers.
- Community and operational value: member participation, education, partner delivery, attendee satisfaction, workflow efficiency, and what the team can improve next time.
Report these categories together when they help explain the event, but do not convert every benefit into revenue. Direct cash ROI and influenced value are different models with different confidence levels.
Choose the goal before the metric
The best event KPI is the one that answers a real question. Use this goal-to-metric matrix to decide which signals belong in the plan and which can be left out.
| Primary goal | Leading signals | Outcome metric | Denominator and source | Review window | Decision enabled |
|---|---|---|---|---|---|
| Build awareness | Qualified reach, event-page visits, partner traffic | New relevant audience reached and retained | Unique people in web analytics, registration, email, or community systems | Campaign through a stated post-event window | Which audience, channel, message, or partner deserves another test? |
| Generate qualified registrations | Source traffic, page engagement, registration starts | Completed registrations from the intended audience | Registrations ÷ qualified event-page visitors; event platform plus web analytics | Promotion start to registration close | Which sources and messages bring likely attendees, not just clicks? |
| Improve attendance | Reminder delivery, calendar adds, access-page visits | Live attendance and stated replay reach | Unique attendees ÷ valid registrants; event and delivery providers | Live event plus a fixed replay window | What should change about timing, reminders, access, or format? |
| Create useful engagement | Session bookings, resource views, poll or question participation | Completion of one defined meaningful action | People completing the action ÷ people eligible for it; provider named | During the event and replay window, reported separately | Which session, format, or interaction should be repeated or changed? |
| Earn event revenue | Ticket mix, checkout starts, sponsor commitments | Net event revenue and direct ROI | Payment, event, affiliate, sponsor, refund, and cost records | Sales open through final refund and direct-sales window | Did the event earn enough to repeat, and which offer drove the return? |
| Create sales or pipeline | Qualified attendance, CTA exposure, offer clicks, booked calls | Attributed purchases, opportunities, or qualified conversations | CRM and payment outcomes ÷ a defined eligible audience | Matched to the actual sales cycle | Which event audience and follow-up path produces defensible commercial value? |
| Educate or strengthen community | Relevant attendance, questions, resource use, repeat participation | Defined learning, adoption, retention, or community outcome | Survey, product, support, community, and attendance records | At the event and at a meaningful follow-up point | Did the event help people do something useful, and what support comes next? |
| Improve operations | Task completion, rehearsal issues, support volume | Cost, cycle time, incident rate, or delivery quality | Project, support, event, and finance records | Planning through debrief | Which process, owner, or tool should change before the next event? |
A registration total without a target audience can reward irrelevant volume. An engagement percentage without an eligible population can hide how it was calculated. A revenue number without refunds, fees, staff time, or event costs can overstate return. Record the denominator and source beside every important KPI.
Five event marketing formulas with clear denominators
Use formulas to make definitions explicit, not to make unlike events look comparable.
1. Registration conversion
Registration conversion rate = completed registrations ÷ qualified event-page visitors × 100
“Qualified” should reflect the audience and traffic you intended to reach. Segment by campaign or source when the numbers are large enough to be meaningful. A source that produces fewer registrations may still be more valuable if those people attend, buy, or fit the event better.
2. Live attendance rate
Live attendance rate = unique live attendees ÷ valid registrants × 100
Decide whether cancellations, invalid registrations, staff, speakers, and very short visits are included. Report replay viewing separately before combining it with live reach. The delivery provider may own the most detailed viewing data even when the event platform owns registration and schedules.
3. No-show rate
No-show rate = registrants who did not attend live ÷ valid registrants × 100
This rate can help investigate timing, reminder, access, expectation, or audience-fit problems. It does not prove why someone missed the event. Use delivery logs, support issues, source segments, and attendee feedback before assigning a cause.
4. Net event revenue
Net event revenue = attributable event revenue − refunds − fees − event costs
Attributable revenue can include tickets, add-ons, sponsors, replay access, donations, affiliate sales, and direct follow-up purchases when the connection is defensible. Event costs can include platforms, payment processing, production, design, contractors, promotion, affiliate payouts, staff time, captioning, venue, travel, equipment, and sponsor fulfilment.
5. Direct event ROI
Direct event ROI = (attributable return − total event cost) ÷ total event cost × 100
Use the dedicated event ROI calculator to assemble the revenue, cost, profit, and return inputs. Keep this measurement plan focused on which outcomes matter, where the data comes from, and how the result should change the next decision.
Audience growth, brand reach, content reuse, community trust, replay value, and future pipeline can be important. Label them as influenced or non-financial value unless you have a documented attribution method that connects them to revenue. Do not quietly add an estimated dollar value to direct return.
Worked example: one event, several useful answers
Suppose an online summit records these illustrative inputs:
- 2,400 qualified event-page visitors
- 720 valid registrations
- 396 unique live attendees
- £12,000 in tickets and paid upgrades
- £4,000 in confirmed sponsor revenue
- £800 in refunds and payment fees
- £9,200 in other event costs, including staff time
- 18 qualified sales conversations within a declared 30-day follow-up window
The event produced a 30% registration conversion rate: 720 ÷ 2,400 × 100. Its live attendance rate was 55%: 396 ÷ 720 × 100. Its no-show rate was 45% when live attendance alone was the definition.
Direct attributable revenue was £16,000. Net event revenue was £6,000 after £800 in refunds and fees and £9,200 in other event costs. Direct ROI was 60%: (£16,000 − £10,000 total cost) ÷ £10,000 × 100.
The 18 sales conversations belong in a separate influenced-value line until their outcomes can be attributed under an agreed method. The right attribution window depends on the event, offer, and sales cycle; 30 days here is an example, not a benchmark.
These calculations answer different questions. Registration conversion helps assess campaign and page performance. Attendance rate helps investigate the journey from signup to participation. Direct ROI helps judge the event's financial return. Qualified conversations help evaluate a downstream commercial hypothesis. Combining them into one “success score” would make the report less useful.
Build the measurement plan before promotion starts
Before launch
- Name the primary goal and decision. Write what success would enable you to repeat, stop, fix, or test.
- Record the baseline and target. Use a comparable previous event or a clearly labelled planning assumption. Do not invent an industry benchmark to fill the gap.
- Assign an owner and source. Decide who is responsible for each KPI and which system is authoritative.
- Set the window and counting rules. Define live versus replay attendance, cancellations, duplicate people, CTA exposure, and direct versus influenced outcomes.
- Test the path. Complete a real registration, source-tagged visit, ticket purchase or test transaction, attendee journey, and relevant integration before campaign traffic arrives.
For campaign attribution, use a shared UTM convention and record it before links spread across partners, email, social, affiliates, or paid promotion. Google's guide to collecting campaign data with custom URLs explains the source, medium, campaign, term, and content parameters. Keep referral or affiliate identifiers separate when they answer a different question.
Event marketing integrations can connect pixels, referral activity, viral sharing, and broader promotion workflows. Test each connection and preserve source names consistently; an integration does not repair an inconsistent campaign taxonomy.
During promotion
Monitor qualified traffic, registration conversion, source or affiliate contribution, ticket mix, refund signals, and support friction. Use this period to catch broken tracking and major message or access problems. Avoid reacting to daily noise when registration volume is too small to support a conclusion.
During the event
Capture live attendance, booked sessions, replay access, and the defined participation signals supported by the event and delivery platforms. Record incidents, support demand, access failures, and schedule changes because they can explain the quantitative result later.
Do not assume the event platform owns every metric. Viewing duration, player interactions, chat, polls, and in-stream calls to action may live with the video provider. Purchases may live in a payment platform. Sales progress may live in the CRM. Surveys and email actions may live elsewhere.
After the event
Reconcile sales, refunds, processing fees, affiliate payouts, sponsor delivery, replay outcomes, survey responses, CRM follow-up, and total costs. Mark missing or unreliable data instead of replacing it with zero. Freeze the report only after the agreed direct and influenced windows have closed.
If registration asks for demographic details or custom information, explain what you collect and how it will be used. The UK Information Commissioner's current guidance on the right to be informed emphasizes providing privacy information when personal data is collected. Treat that as a transparency principle, not a claim that one registration notice guarantees compliance everywhere.
Use each system for the data it actually records
HeySummit is the event operating layer for online, hybrid, in-person, and on-demand events. It brings event pages, registration, ticketing, speakers, sponsors, affiliates, email, integrations, analytics, and replays into one workflow.
HeySummit event reporting and analytics documents event page views, conversion rates, attendee numbers, revenue, attendee schedules, sales and refunds, locations, answers to custom registration questions, and live and replay attendance. Use the relevant provider, CRM, payment platform, email tool, survey, or custom question for data that sits outside those documented fields.
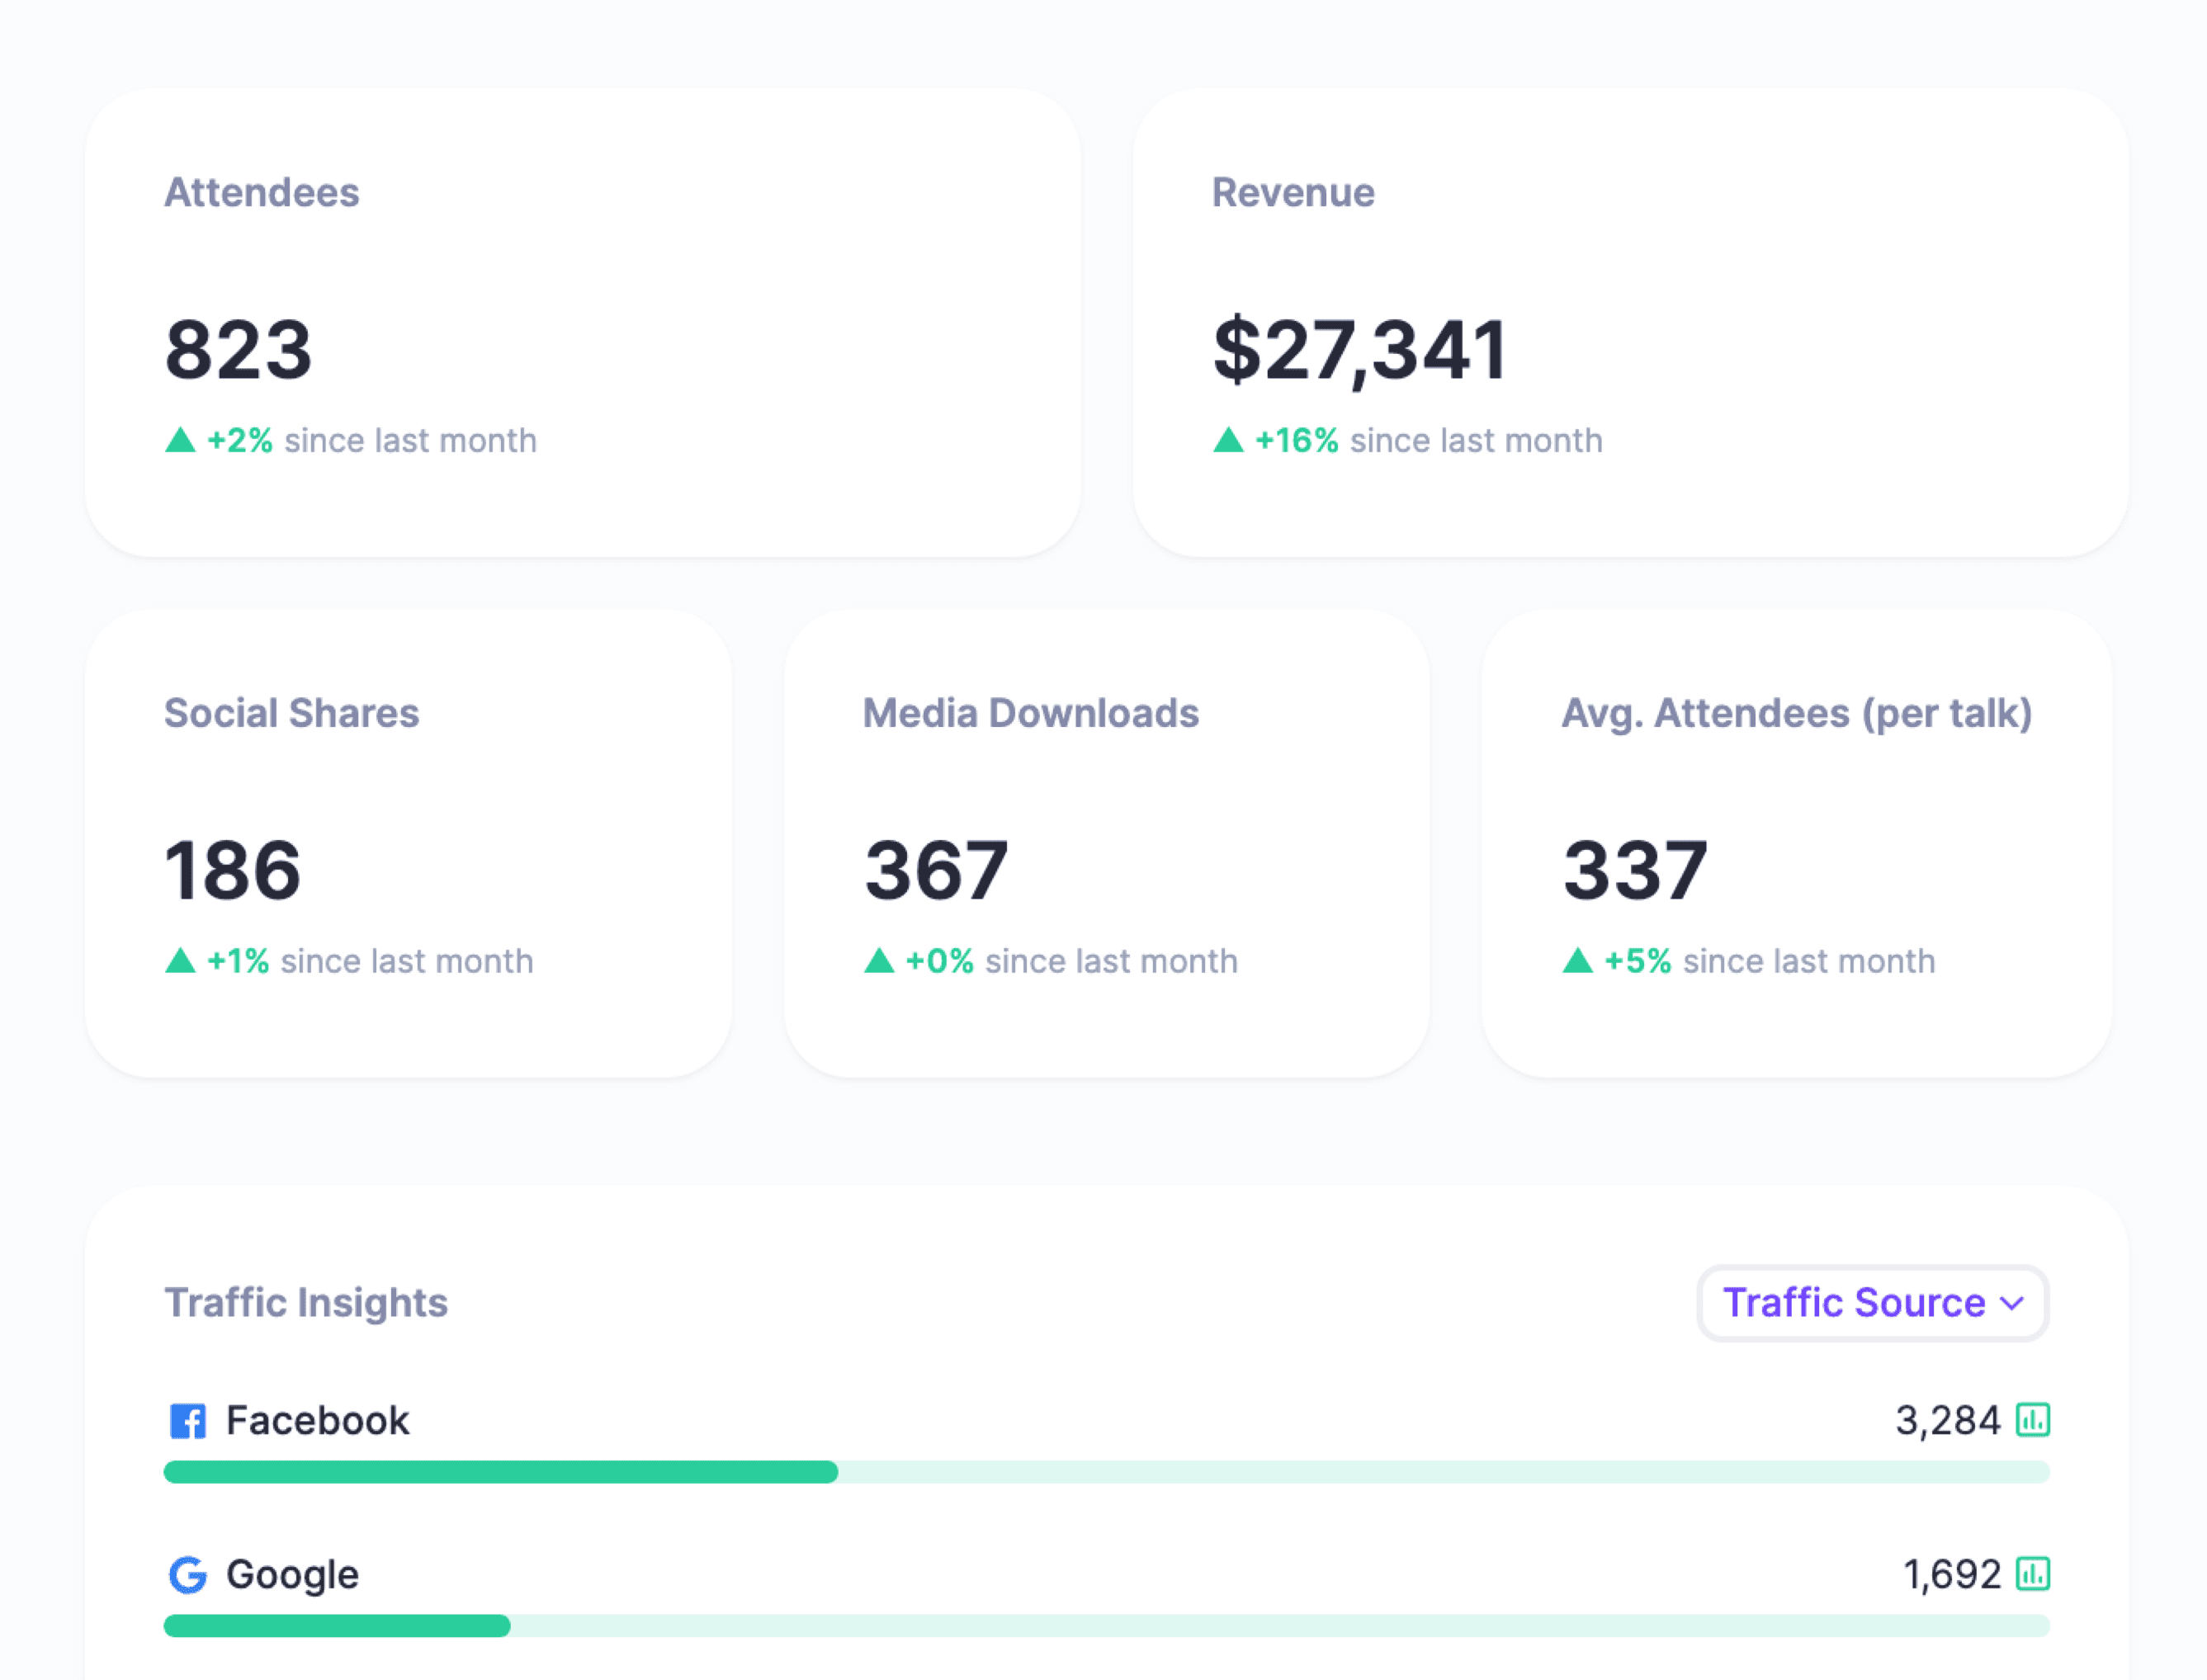
Age and industry are not automatically known. Location or custom-question answers only exist when the relevant data is available or attendees are asked for it. Video-provider details and comments also depend on the connected experience. Keep every claim tied to the field and system that produced it.
Turn event metrics into decisions
A useful debrief compares the goal and target with the actual result, states the denominator, identifies the source, distinguishes signal from causation, and exposes tracking gaps.
- Confirm the data is comparable. Check whether definitions, tracking, audience, offer, or event format changed.
- Find the first meaningful gap. A weak sales result may begin with audience quality, attendance, CTA exposure, follow-up, or tracking. Do not jump to the last stage.
- Pair numbers with context. Review source segments, delivery logs, support issues, survey responses, sales notes, and the actual event experience.
- Separate evidence from explanation. A drop is observable. The reason is a hypothesis until other evidence supports it.
- Choose the next action. Name what to repeat, stop, fix, or test, who owns it, and what evidence would validate the choice.
Use the post-event report template to turn the measurement plan into a stakeholder-ready summary with goals, metrics, evidence, lessons, owners, and next actions.
Start with one primary goal, a small set of named metrics, and honest data boundaries. Then review reporting and analytics for the event metrics HeySummit supplies, or see how HeySummit works across the full event workflow. When the plan is clear, a free trial can help you test the operating setup with your own event.
Frequently asked questions
Table of Contents
What does event marketing success mean?Choose the goal before the metricFive event marketing formulas with clear denominatorsWorked example: one event, several useful answersBuild the measurement plan before promotion startsUse each system for the data it actually recordsTurn event metrics into decisionsFrequently Asked QuestionsTry HeySummit free
HeySummit is the easiest way for creators and educators to grow their audience, authority and revenue with professional online events created in minutes, not weeks.
Share this article on:
Recent Posts
Loading feed...