Webinar Analytics: KPIs, Formulas, Benchmarks & Actions

Sarah Wisbey
Content Contributor, HeySummit
Webinar analytics are the metrics that show how people move from promotion to registration, attendance, engagement, action, and revenue. The useful approach is to choose KPIs from the webinar goal, calculate each one consistently, compare like with like, and use the result to decide what to change.
Every KPI needs four things: a numerator, a denominator, a measurement window, and a source system. Without them, a percentage may look precise while describing a different audience or stage from one webinar to the next.
Turn webinar attention into measurable action
Meet HeyStream, our sister product for running branded live webinars, placing calls to action where attention is highest, and measuring the bookings, signups, purchases and clicks each broadcast drives.
Choose webinar KPIs from your goal
Start with one primary outcome. Then use diagnostic metrics to explain why that outcome moved. A webinar cannot optimize equally for reach, attendance, interaction, pipeline, and revenue at the same time.
- Awareness: make qualified reach or page visits the primary KPI. Use promotion click-through rate, source mix, and new-audience share as diagnostics.
- Demand capture: make valid registrations or visitor-to-registration rate primary. Diagnose the result with traffic quality, landing-page conversion, form completion, and registration source.
- Attendance: make live attendance rate or total live-and-on-demand attendance rate primary. Use reminders, timing, access failures, and replay availability as diagnostics.
- Engagement: make one predefined action rate or a clearly defined viewing measure primary. Diagnose with watch time, poll responses, questions, chat, and content milestones only when the delivery system exposes them.
- Conversion: make one qualified action—such as a trial, demo, application, or purchase—primary. Use CTA exposure, CTA completion, audience fit, and follow-up response as diagnostics.
- Revenue: make attributable revenue, influenced pipeline, or return on investment primary, but name which one you mean. Do not combine sourced revenue, influenced pipeline, and non-revenue outcomes into a single success number.
- Promotion exposure (count) → tracked campaign clicks (count) → promotion CTR (rate)
- Qualified page visitors (count) → valid registrations (count) → visitor-to-registration rate (rate)
- Valid registrants (count) → live and on-demand viewers (counts) → attendance rates (rates)
- Eligible viewers (count) → defined interactions and CTA completions (counts) → action rates (rates)
- Qualified actions (count) → attributable benefit and cost (currency) → webinar ROI (rate)
Webinar KPI formulas and what to do with them
A metric earns its place when it can change a decision. Keep channel denominators separate, define who was eligible for an action, and use the system closest to the behavior as the source of truth.
On a phone, swipe sideways to see all columns in this KPI table.
| KPI | Formula | What it diagnoses | Likely source | Important caveat | Useful next action |
|---|---|---|---|---|---|
| Promotion CTR | Tracked campaign clicks ÷ impressions × 100 | Whether a promotion earned the next click | Email, paid-media, social, or partner platform | Email, paid, organic social, and partner impressions are not interchangeable | Test the promise, creative, audience, or channel separately |
| Visitor-to-registration rate | Completed valid registrations ÷ qualified page visitors × 100 | Traffic quality and registration-page performance | Event platform plus web analytics | Exclude bots, staff tests, and irrelevant visits consistently | Improve the promise, proof, form, CTA, or event landing page builder experience |
| Registrations | Count of valid unique registrations | Demand captured before attendance | Event platform | This is a count, not a conversion rate; duplicates and low-fit signups can inflate it | Segment by source, audience, qualification, and campaign |
| Live attendance rate | Unique live attendees ÷ valid registrants × 100 | Movement from signup to the live session | Event platform plus delivery provider | Define what qualifies as attendance and handle staff or duplicate joins | Review timing, access, qualification, and webinar reminder emails |
| Total attendance rate | Unique live-or-on-demand attendees ÷ valid registrants × 100 | Total content consumption beyond the live window | Event platform plus delivery provider | Dedupe people who watched both live and on demand; state the replay window | Improve replay timing, access, and on-demand content and replay access |
| Average watch time or milestone retention | Total watched minutes ÷ unique viewers, or viewers at milestone ÷ viewers who started × 100 | Whether viewers stayed with the session | Webinar, video, or broadcast provider | Use only the viewing data the provider exposes; average watch time is not an exact drop-off timestamp | Rework the opening, pacing, structure, or duration |
| Engagement rate | Attendees completing a predefined action ÷ attendees eligible for it × 100 | Response to a poll, question prompt, chat moment, or another defined interaction | Delivery provider | Define the action before the event; do not merge unlike interactions into a vague score | Change the prompt, timing, format, or eligibility |
| CTA completion rate | Completed target actions ÷ people who saw or could reasonably see the CTA × 100 | Whether an offer and its placement led to action | Delivery platform, web analytics, or destination system | A click is not always a completed action or proof of buying intent | Improve the offer, wording, timing, destination, or follow-up |
| Qualified-action rate | Qualified demos, trials, leads, or purchases ÷ explicitly named eligible audience × 100 | Whether the webinar moved the right people toward the intended outcome | CRM, product analytics, or commerce system | Name the qualification rule, audience, and attribution window | Change targeting, CTA, nurture, sales handoff, or offer |
| Webinar ROI | (Attributable benefit − webinar cost) ÷ webinar cost × 100 | Whether attributable value exceeded the investment | Finance, CRM, commerce, and cost records | Separate sourced revenue, influenced pipeline, and non-revenue goals; document the attribution rule | Reallocate spend, change the audience or offer, or choose a more appropriate outcome measure |
For a deeper treatment of the middle and bottom of the funnel, use the guide to webinar conversion-rate formulas and funnel metrics.
Use webinar benchmarks as context, not a target
There is no universal “good webinar attendance rate.” Format, audience, topic, promotion, access window, and the definition of attendee all affect the result. Your own comparable webinars are usually the best starting benchmark.
For external context, ON24's 2026 webinar benchmark material reports a 60% registration-to-attendee conversion, 49 minutes of average engagement, and a 52% on-demand share across its global 2025 platform data. Those are ON24-specific figures, not promises for every webinar. Compare the format, audience, measurement window, and definitions before treating them as useful context.
A benchmark should produce a question, not a verdict. If your total attendance rate is lower, check access, qualification, reminders, timing, replay window, and counting rules before assuming the content failed. If it is higher, verify that the denominator and deduplication method did not change.
How to analyze webinar performance
- Set one primary outcome before launch. Choose the single result the webinar should move, then name the diagnostic metrics that may explain it.
- Document the stages and windows. Define the event window, replay window, attribution window, and the owner of every source.
- Capture source consistently. Use campaign parameters, referral data, and registration-source fields in the same way across channels.
- Reconcile the systems. Bring together event-page and registration data, the delivery provider's viewing and interaction reports, CRM outcomes, and revenue records. Dedupe people who attended live and watched the replay.
- Segment only when it helps. Compare source, audience, live versus on-demand viewing, and CTA exposure when the sample size can support a useful decision.
- Compare with your own baseline first. Use the same event type, audience, definitions, and windows. Treat external benchmarks as directional context.
- Write one diagnosis and one next experiment. A report is incomplete until it says what probably happened, what remains uncertain, and what the next webinar will test.
Worked example: from page visits to revenue
Imagine a webinar registration page receives 2,000 qualified visitors during the campaign. It records 500 valid unique registrations, so visitor-to-registration rate is 500 ÷ 2,000 = 25%.
220 unique registrants attend live, giving a live attendance rate of 220 ÷ 500 = 44%. Another 110 people watch on demand. Twenty of them also attended live, so total unique viewers are 220 + 110 − 20 = 310. Total attendance rate is therefore 310 ÷ 500 = 62%, using a 14-day replay window.
A CTA is shown to 280 eligible viewers. 42 complete the target action, so CTA completion rate is 42 ÷ 280 = 15%. After the qualification rule is applied, 12 become qualified demos. If all 310 viewers were eligible for that outcome, qualified-demo rate is 12 ÷ 310 = 3.9%.
The webinar costs £8,000 and produces £20,000 in revenue under the team's documented attribution rule. Webinar ROI is (£20,000 − £8,000) ÷ £8,000 = 150%. If the £20,000 is influenced pipeline rather than collected or attributable revenue, label it separately and do not put it into the ROI formula as though it were the same thing.
The useful diagnosis might be: the page converted well, replay consumption materially increased total attendance, but only 42 of 280 CTA-eligible viewers acted. The next experiment should therefore test the CTA offer or timing—not rebuild the registration page without evidence.
Give every webinar system one reporting job
A complete webinar report normally spans several systems. The event platform manages the registration and event funnel. The delivery provider records the live or recorded viewing experience. The CRM, product, or commerce system records what happened after the CTA. Trying to force one tool to own every stage creates false precision.
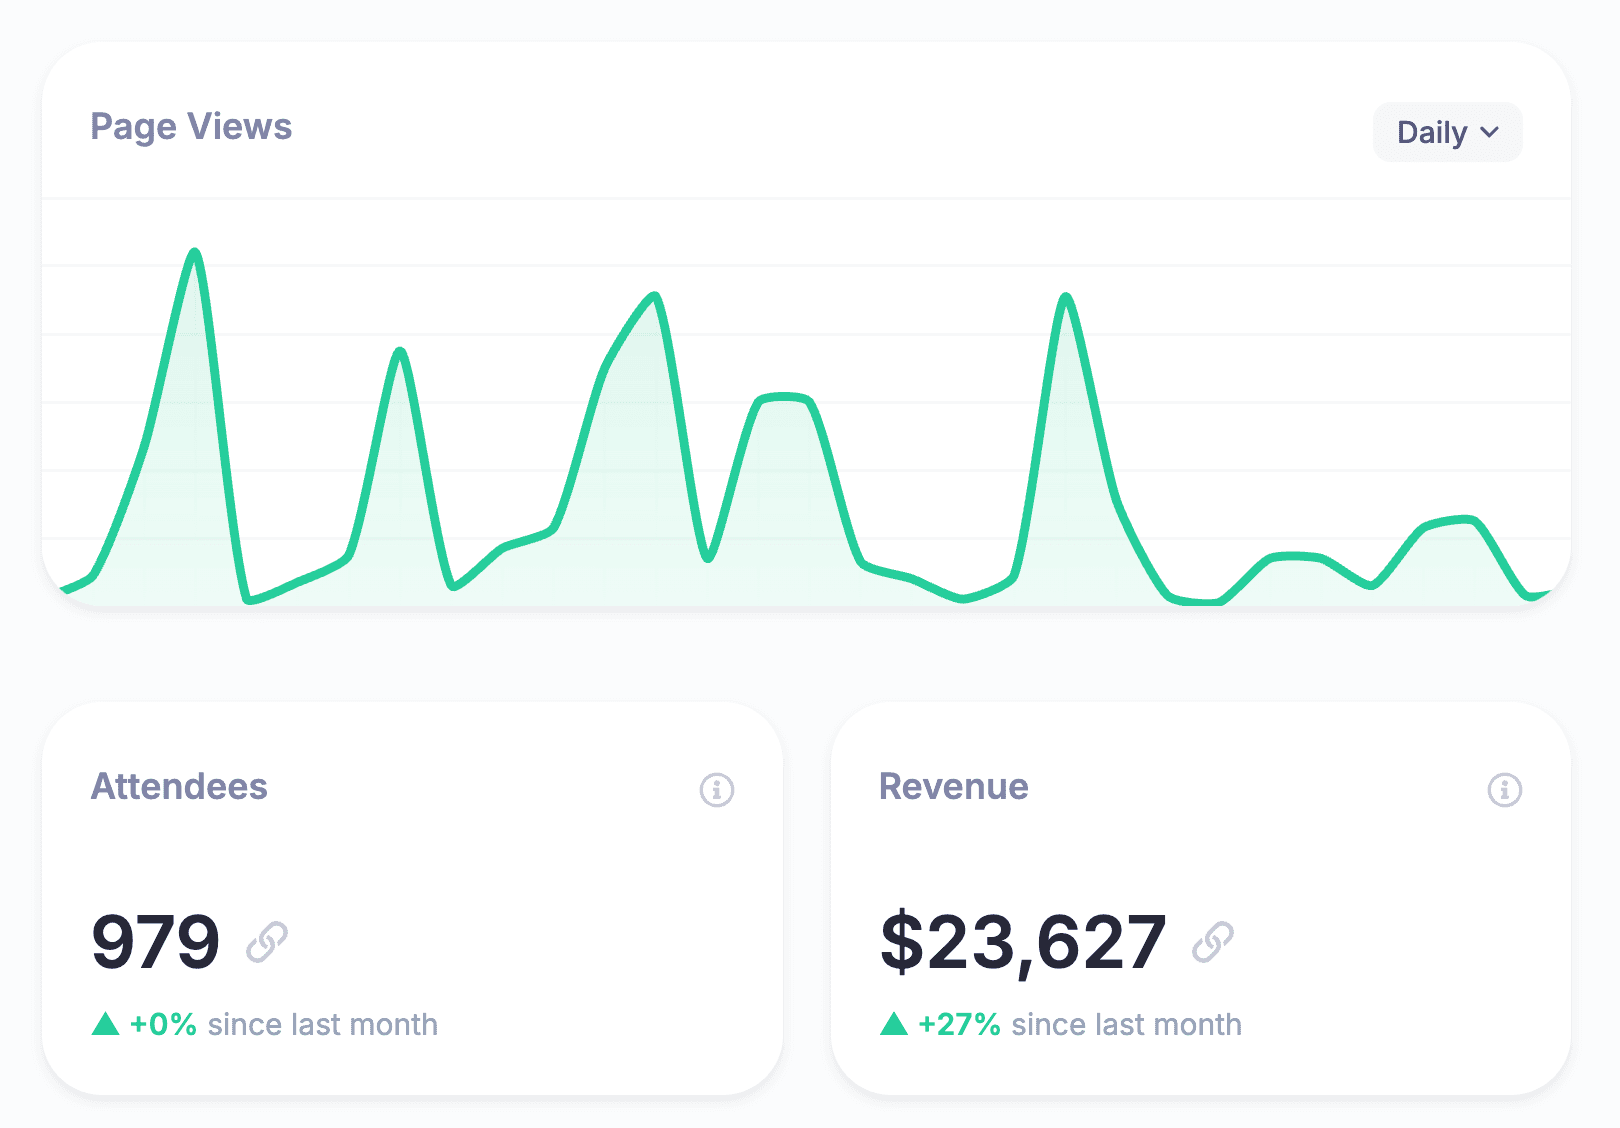
HeySummit's current event reporting and analytics includes page views, registration conversion, attendees, revenue, custom registration insights, attendee schedules, and live or replay attendance. Referral and custom registration data can help explain who arrived and how they entered the event funnel.
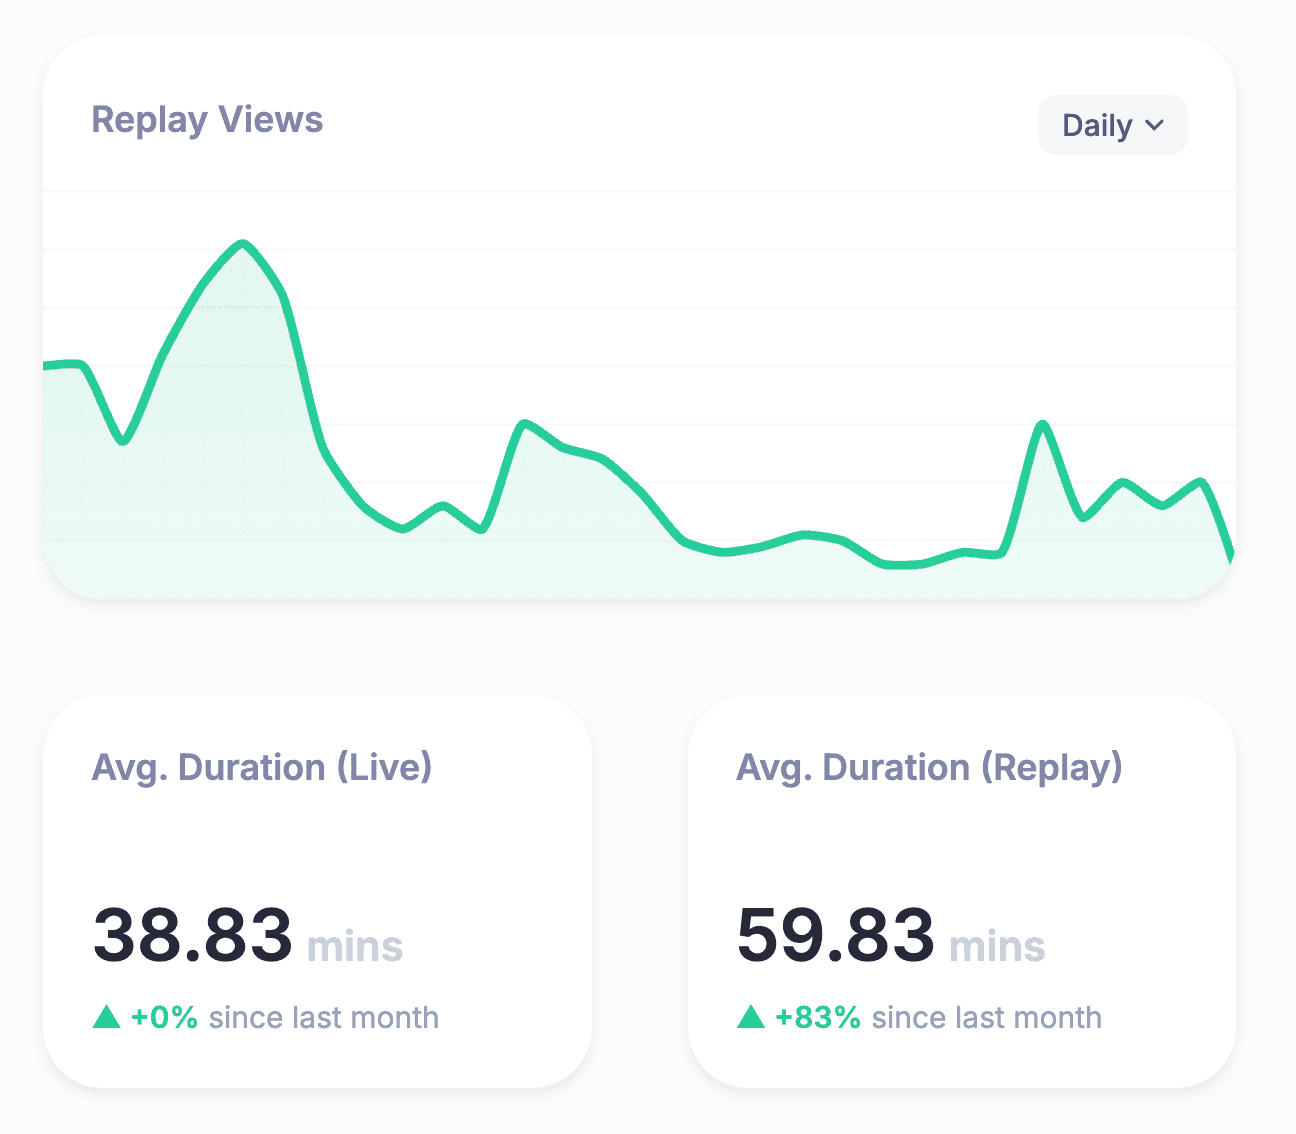
Provider reports fill in delivery-specific detail. For example, Zoom's webinar reporting documentation describes registration, attendee, performance, Q&A, poll, and survey reports, including join, leave, and total session time. The exact reports available depend on the provider, setup, permissions, and plan.
Use the delivery provider for viewing, polls, questions, chat, surveys, and join-or-leave detail that it actually exposes. Use the CRM or destination system for trials, demos, purchases, pipeline, and follow-up outcomes. This preserves the boundary between observed behavior and inferred business impact.
Turn webinar analytics into one next experiment
End every webinar review with a short decision record:
- Primary result: what happened to the goal metric?
- Best diagnosis: which stage most likely explains it?
- Evidence: which source, denominator, segment, and window support that view?
- Uncertainty: what could the data not tell you?
- Next test: what one change will the next comparable webinar make?
For multi-session events, summits, paid workshops, and on-demand programs, HeySummit can keep pages, registration, attendees, emails, access, replays, and event-level reporting in one workflow. Start with the reporting and analytics feature, then start a free trial when you are ready to connect measurement to the wider event journey.
If the main job is a branded B2B broadcast with measurable CTAs inside live and replay viewing, HeyStream is a separate product for that workflow. Its webinar conversion tools track CTA impressions, clicks, and performance alongside live and replay activity. Keep those in-broadcast signals separate from HeySummit's broader event-management and funnel reporting.
Frequently asked questions
Table of Contents
Choose webinar KPIs from your goalWebinar KPI formulas and what to do with themUse webinar benchmarks as context, not a targetHow to analyze webinar performanceGive every webinar system one reporting jobTurn webinar analytics into one next experimentFrequently Asked QuestionsTry HeySummit free
HeySummit is the easiest way for creators and educators to grow their audience, authority and revenue with professional online events created in minutes, not weeks.
Share this article on:
Recent Posts
Loading feed...