Webinar Conversion Rates: Formulas, Benchmarks, and Funnel Metrics

Sarah Wisbey
Content Contributor, HeySummit
A webinar conversion rate measures movement from one defined funnel stage to the next. There is no single webinar conversion rate: a landing-page visit becoming a registration, a registrant attending live, an attendee completing a call to action, and an attributed lead becoming a customer are different rates with different denominators.
Before you compare results or try to improve them, name the stage, numerator, denominator, reporting window, and source system. That small discipline prevents a healthy attendance rate from being mistaken for a sales rate—and makes the result useful enough to act on.
Turn webinar attention into measurable action
Meet HeyStream, our sister product for running branded live webinars, placing calls to action where attention is highest, and measuring the bookings, signups, purchases and clicks each broadcast drives.
What is a webinar conversion rate?
“Webinar conversion rate” is an umbrella term for the percentage of eligible people who complete a defined action at a particular stage of the webinar journey. The basic formula is:
Stage conversion rate = people who completed the action ÷ people eligible to complete it × 100
The denominator is part of the metric, not a footnote. If 40 people book a demo, the result could be divided by landing-page visitors, registrants, live attendees, on-demand viewers, people who saw the call to action, or qualified leads. Each calculation answers a different question.
| Funnel stage | Useful rate | Numerator | Denominator | What it helps diagnose |
|---|---|---|---|---|
| Discovery to registration | Visitor-to-registration rate | Completed registrations | Qualified event-page visitors | Audience-message fit and registration-page friction. |
| Registration to live attendance | Live attendance rate | Unique live attendees | Valid registrants | Reminder, timing, access, and expectation-setting issues. |
| Attendance to meaningful participation | Engagement rate | Attendees who complete a defined engagement action | Attendees eligible for that action | Whether the format creates the participation you intended. |
| Exposure to action | CTA completion rate | Completed calls to action | People who were shown or could reasonably see the CTA | Offer relevance, timing, clarity, and action friction. |
| Lead to customer | Attributed sales rate | Attributed customers or purchases | Defined eligible leads, attendees, or exposed viewers | Commercial follow-through within a stated attribution window. |
Some platforms use different labels for the same calculation. For example, the ON24 registration conversion definition divides attendees by registrants. In this guide, that calculation is called the registration-to-attendance rate, while visitor-to-registration rate means registrations divided by event-page visitors. Whichever label your team uses, write the formula beside it.
This guide focuses on conversion between funnel stages. For the wider set of acquisition, attendance, engagement, replay, and outcome measures, use this companion guide to webinar analytics.
Five webinar conversion formulas worth tracking
1. Visitor-to-registration conversion
Completed registrations ÷ qualified event-page visitors × 100
This rate connects the campaign promise to the registration experience. Segment it by source, campaign, device, and relevant audience when volume allows. A low result can signal a mismatch between the promotion and the page, unclear value, an inconvenient date or time, weak speaker or agenda information, technical friction, or an audience that was never likely to register.
Do not assume the page is the problem from the percentage alone. Compare sources, inspect the page journey, and review where people abandon before you change the copy. Use this event landing page checklist to audit the promise, logistics, accessibility details, form, and call to action.
2. Registration-to-attendance conversion
Unique live attendees ÷ valid registrants × 100
This is often called attendance rate, show rate, or registration conversion. Decide whether cancellations and invalid registrations are removed, whether a person must stay for a minimum period to count, and whether on-demand viewers are reported separately.
As a narrow point of external calibration, ON24's 2026 benchmark summary reports a 60% registrations-to-attendees average for webinars hosted on its platform during 2025. That is not a universal “good webinar conversion rate” and it does not describe CTA or sales performance. Your audience, acquisition mix, format, timing, reminder sequence, access requirements, and counting rules may be very different.
If your own attendance rate falls, check reminder delivery and timing, calendar details, time zones, access instructions, changes to the topic or speaker, and whether the registration page promised the experience delivered. A clear event reminder email sequence can reduce avoidable confusion, but it cannot repair weak audience fit.
3. Attendee engagement rate
Attendees completing a defined engagement action ÷ eligible attendees × 100
“Engaged” must be observable. It might mean answering a poll, asking a question, downloading a resource, visiting a sponsor offer, completing a worksheet, or staying for a defined portion of the session. Do not quietly change the definition between webinars.
Use provider-specific data for actions that happen inside the webinar player. A short viewing duration or low interaction rate is a signal, not proof that the content was poor. People may leave because of timing, technical trouble, role mismatch, a promised topic appearing earlier than expected, or because they received the answer they needed quickly.
4. Call-to-action completion rate
Completed CTA actions ÷ people exposed to the CTA × 100
A CTA may ask someone to book a demo, start a trial, buy, register for another event, join a community, download a resource, or complete a survey. Use the smallest defensible denominator. If the CTA appeared only in the final ten minutes, dividing completions by every registrant obscures how the offer performed among people who could actually see it.
Define completion, exposure, and the reporting window in advance. Clicks and completions are different. A click can be measured in the webinar or streaming layer, while a completed booking, signup, or purchase may live in a scheduling tool, CRM, checkout, or product analytics system.
5. Attributed sales conversion
Attributed purchases or customers ÷ defined eligible leads or attendees × 100
State what “attributed” means. Direct webinar sales might include purchases through a webinar-specific link during the session and for seven days afterward. Influenced sales might include attendees who later entered a sales process, but that is not the same as a direct transaction. Keep the categories separate.
When revenue and costs matter, use the event ROI calculator to model profit and return without folding every financial question into the conversion-rate dashboard.
Worked example: one webinar, several valid rates
Suppose a webinar records the following illustrative results:
- 1,000 qualified landing-page visitors
- 260 completed registrations
- 143 unique live attendees
- 60 additional registrants who watch on demand within 14 days
- 82 live attendees who complete the defined engagement action
- 120 people shown the primary CTA and 24 who complete it
- 6 attributed sales from those 24 qualified CTA leads within 30 days
The resulting rates are:
- Visitor-to-registration: 260 ÷ 1,000 × 100 = 26%
- Live attendance: 143 ÷ 260 × 100 = 55%
- Live-or-on-demand reach within 14 days: (143 + 60) ÷ 260 × 100 = 78.1%
- Defined live engagement: 82 ÷ 143 × 100 = 57.3%
- CTA completion among exposed viewers: 24 ÷ 120 × 100 = 20%
- Qualified-lead-to-sale conversion: 6 ÷ 24 × 100 = 25%
These are examples, not performance benchmarks. The same six sales could also be divided by 143 live attendees to produce a 4.2% attendee-to-sale rate. Both calculations can be valid, but they answer different questions. Label the denominator instead of presenting either number as “the webinar conversion rate.”
Build a webinar measurement plan before launch
A measurement plan keeps the event platform, webinar provider, marketing tools, and revenue systems aligned. Agree the events and ownership before promotion starts, then test the data path with a registration and a real attendee journey.
| Stage | Event to record | Numerator | Denominator | Source system | Owner and window |
|---|---|---|---|---|---|
| Registration | Registration completed | Valid registrations | Qualified event-page visitors | Event platform and web analytics | Growth owner; campaign start to registration close |
| Attendance | Attendee joins live | Unique live attendees | Valid registrants | Event platform and delivery provider | Event owner; live session |
| On demand | Registrant starts replay | Additional unique replay viewers | Registrants who did not attend live, or all registrants if clearly labelled | Event platform and delivery provider | Content owner; stated replay window |
| Engagement | Defined meaningful action completed | Eligible attendees completing it | Attendees eligible for that action | Delivery, polling, download, or event tool | Producer; live and replay windows reported separately |
| CTA | Primary action completed | Completed actions | People exposed to the CTA | Streaming CTA layer, scheduling tool, form, or checkout | Campaign owner; declared action window |
| Sales | Purchase or qualified opportunity attributed | Attributed sales or opportunities | Defined eligible attendees or leads | CRM, payment platform, and attribution record | Revenue owner; agreed sales-cycle window |
For campaign links, keep UTM naming consistent rather than inventing a new convention for every partner or channel. Google's guidance on collecting campaign data with custom URLs explains the source, medium, campaign, term, and content parameters. Use those parameters consistently and preserve referral or affiliate identifiers when they answer a different question.
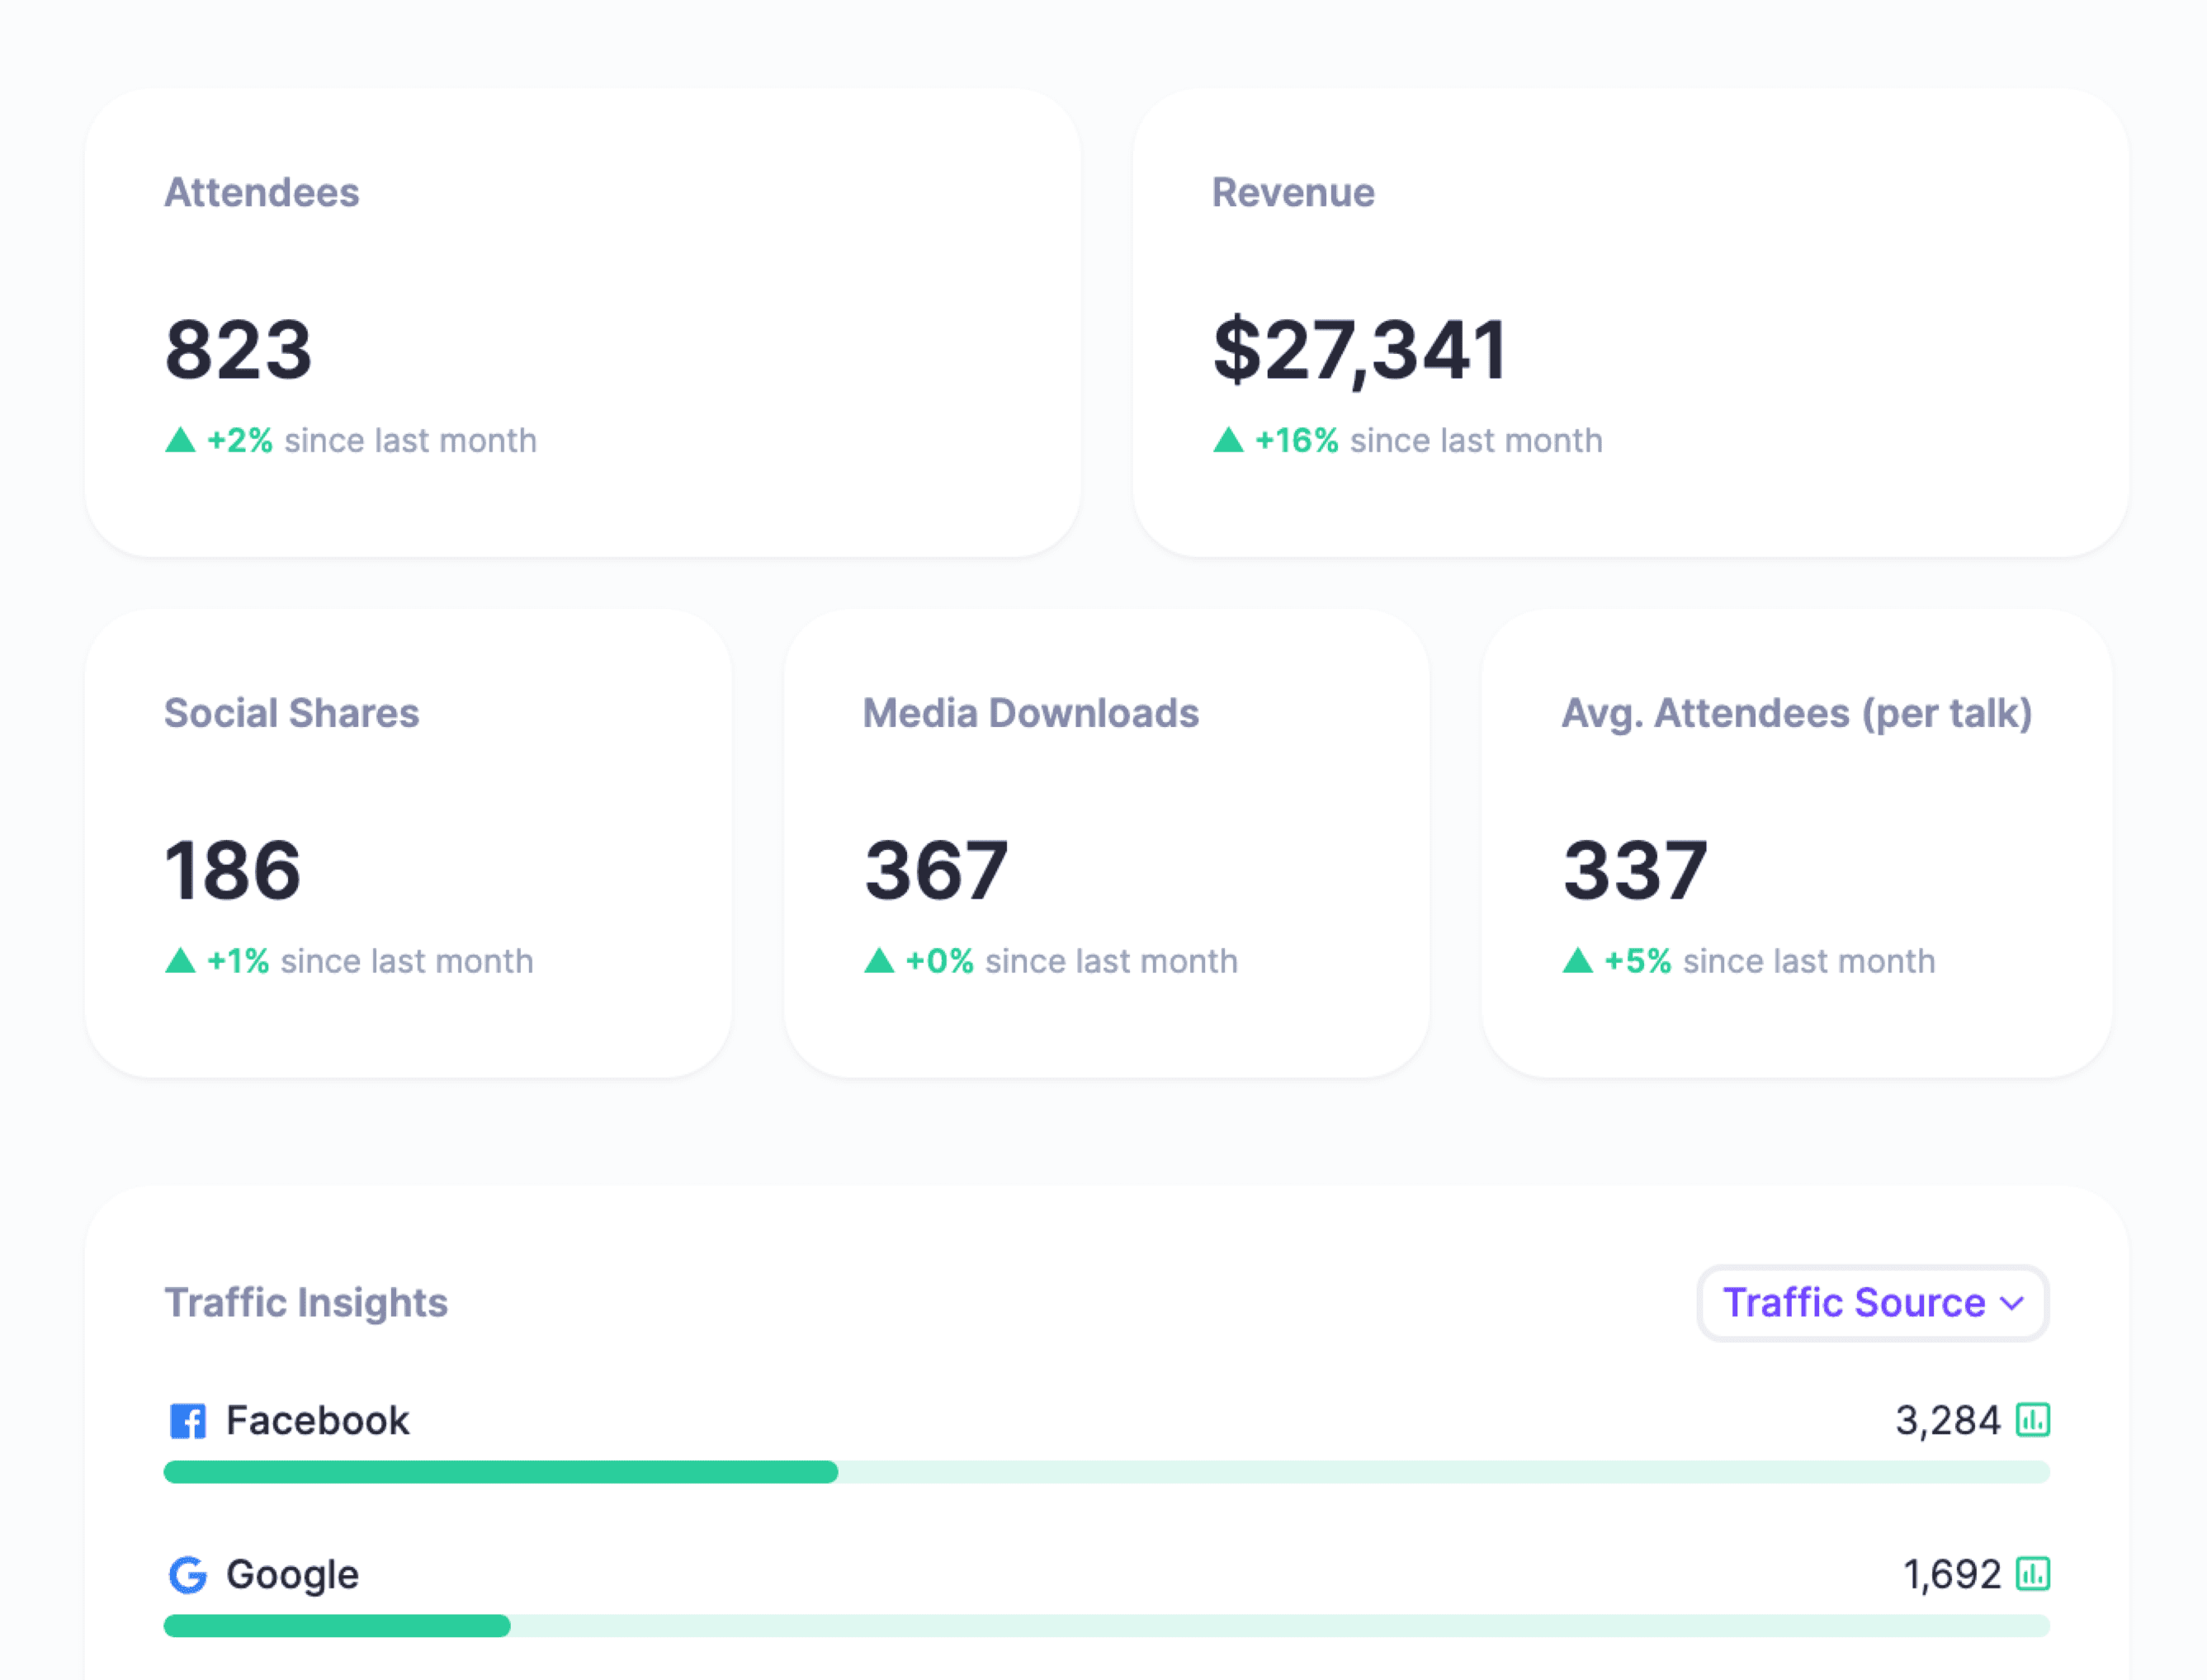
HeySummit's event reporting and analytics covers event page views, conversion rates, attendee numbers, revenue, attendee schedules, sales and refunds, location and custom-registration-question data, plus live and replay attendance. Data about viewing duration, in-player polls, chat, CTA exposure, CRM progress, checkout completion, surveys, or ad performance may come from the connected delivery, streaming, marketing, payment, or CRM tool.
Improve the stage that is actually underperforming
Start with the first meaningful drop between stages. Do not respond to a weak sales result by changing the registration page if registration is already healthy and the real break occurs after the call to action.
- Many relevant visitors, few registrations: check message match, page clarity, date and time, speaker and agenda proof, form friction, accessibility information, and the source mix.
- Many registrations, few live attendees: check reminder delivery, calendar details, time zones, access steps, topic drift, and whether the on-demand option changes live urgency.
- Healthy attendance, little defined engagement: check whether the action was relevant, visible, accessible, and appropriate for the format. Also check technical failures and whether engagement was optional by design.
- Healthy engagement, weak CTA completion: check offer fit, timing, clarity, exposure, mobile behavior, destination-page friction, and whether the action matches the webinar promise.
- CTA completions, few attributed sales: check lead quality, follow-up speed, sales-cycle length, tracking gaps, qualification, offer fit, and the difference between direct and influenced outcomes.
Each bullet is a set of hypotheses, not a diagnosis. Pair the funnel data with page behavior, delivery logs, attendee feedback, support tickets, CRM notes, and a replay of the actual webinar experience before you decide what caused the result.
How to benchmark webinar conversion rates
The most useful benchmark is a comparable baseline from your own events. Compare the same funnel stage, definition, audience, source mix, event format, offer, and reporting window. A product demo for existing leads should not be benchmarked casually against a broad educational webinar promoted to cold audiences.
Use external benchmarks as context, not a target handed down without methodology. Record the provider, year, dataset, webinar type, calculation, and scope. If the source does not reveal the numerator and denominator, do not use the number to guide a decision.
A practical review sequence is:
- Confirm the tracking and counting rules did not change.
- Compare the result with your own like-for-like baseline.
- Segment by source, audience, device, attendance mode, or offer only when sample size supports it.
- Use an external benchmark to generate questions, not to declare success or failure.
- Choose one change tied to the weakest stage and define what evidence would support it.
Then turn the results into a short decision record. This post-event report template helps connect goals, metrics, evidence, lessons, owners, and next actions.
Turn webinar data into the next decision
A trustworthy webinar report does not search for one impressive percentage. It shows who moved between clearly defined stages, what each system recorded, where tracking is incomplete, and which change the evidence supports.
Use HeySummit to organize the event journey around pages, registration, ticketing, speakers, affiliates, emails, integrations, analytics, and replays. If your webinar also needs branded live production and in-stream calls to action, HeyStream's conversion tools provide a separate streaming and CTA layer; keep those metrics identified by their source.
Review HeySummit reporting and analytics to see which event metrics are available, then build a measurement plan that joins the remaining provider, CRM, payment, survey, and campaign data without mixing their denominators.
Frequently asked questions
Table of Contents
What is a webinar conversion rate?Five webinar conversion formulas worth trackingWorked example: one webinar, several valid ratesBuild a webinar measurement plan before launchImprove the stage that is actually underperformingHow to benchmark webinar conversion ratesTurn webinar data into the next decisionFrequently Asked QuestionsTry HeySummit free
HeySummit is the easiest way for creators and educators to grow their audience, authority and revenue with professional online events created in minutes, not weeks.
Share this article on:
Recent Posts
Loading feed...