Event Goals and Objectives Examples: A Goal-to-KPI Planning Template
-1690817315934-652794559.png&w=96&q=75)
Benjamin Dell
Founder, HeySummit
An event goal is useful only when it changes a decision. “Grow our audience” is a direction; a workable plan connects that direction to a defined audience, a measurable objective, a KPI, a target, a data source, an owner, and a review date.
This guide gives you event goals and objectives examples for audience growth, revenue, education, community, sponsors, and replay. It also includes a copyable goal-to-KPI template, so you can decide what success means before the event starts.
You do not need a sprawling measurement plan. For a small team, one primary goal and one or two supporting outcomes are usually enough. The important part is knowing what you can measure, who owns the data, and what you will do with the result.
The event goal stack: goal, objective, KPI, metric, and target
Teams use these terms differently. Consistency inside your event plan matters more than policing the vocabulary. This is a practical way to separate them:
- Goal: the broad result or direction you want, such as growing a qualified audience.
- Outcome: the change you expect for a defined audience or for the organisation.
- Objective: specific, controllable progress toward that outcome.
- KPI or indicator: the signal you will use to judge progress.
- Metric or measure: the value you collect for that indicator.
- Target: the expected value and the time window in which you expect it.
- Source and owner: the system that holds the data and the person responsible for reviewing it.
For example, “build our email audience” is a goal. “Add relevant new subscribers through this event” is an outcome. “Generate qualified, opted-in registrations from people who were not already on the list” is an objective. The KPI might be the number and share of new-to-list registrants, measured in your event platform and email or CRM system.
The CDC’s program-evaluation guidance recommends defining the expected change and evaluation question before choosing indicators, measures, and data sources. That principle transfers neatly to event planning: decide what you need to learn before opening the dashboard.
Start with the decision, not the dashboard
A metric earns a place in your plan when a result will change what you do. Ask: “If this is below, on, or above target, what decision will we make?”
Work backward through this chain:
- Name the change you want for a specific audience or part of the business.
- Choose an activity the event team can control.
- Define the immediate output of that activity.
- Select an indicator that connects the output to the intended outcome.
- Choose a measure, baseline, target, time window, source, and owner.
- Write the decision the result will trigger.
The UK Government Analysis Function’s Theory of Change toolkit recommends doing this design work early: agree the intended impact, state assumptions, and plan KPIs, targets, sources, and baselines before delivery.
Also mark how much control the event team has. Registration-page copy is within your control. Whether a registrant attends is something you can influence. Whether they become a customer months later depends on other touchpoints, people, and systems. Keeping those boundaries visible prevents an event output from being reported as proof of a downstream outcome.
Copyable goal-to-KPI planning template
Start with the minimum version below. Replace the worked example with your own plan, then add another row only when it represents a genuinely different outcome.
On a phone, swipe sideways to see every column in this table.
| Primary goal | Objective | KPI and formula | Baseline | Target and window | Source | Owner | Decision |
|---|---|---|---|---|---|---|---|
| Grow a qualified audience | Generate opted-in registrations from people who are new to our list | New-to-list registrants ÷ registrants with a known list status | Previous comparable event or “no baseline” | Our hypothesis: ___% by registration close | Event platform + CRM/email | Audience lead | Below: review channel mix. On target: repeat. Above: test the strongest source again. |
| ________ | ________ | ________ | ________ | ________ | ________ | ________ | ________ |
For a fuller plan, copy the same row and add these fields:
- audience or segment;
- event format;
- activity and immediate output;
- numerator and denominator or eligible population;
- data availability date and collection method;
- confidence, limitations, and outside dependencies;
- reporting audience and follow-up action.
Put the measurement milestones into your event planning timeline. A KPI without a collection date is easy to remember only after the useful data has disappeared.
How to choose a target without inventing a benchmark
The best starting point is a comparable baseline from your own events, audience, and channels. A target borrowed from an unrelated event can look authoritative while telling you very little.
When you have a baseline, adjust it for material differences:
- audience size and familiarity;
- paid or free access;
- channel mix and partner reach;
- online, in-person, hybrid, or on-demand format;
- measurement window;
- changes in tracking or data quality.
If you do not have a baseline, label the first target as a hypothesis. Use the event to establish a reference point instead of presenting your guess as an industry standard. For a very small denominator, report the count as well as the percentage: “4 of 12 eligible attendees” is more informative than “33%.”
Freeze the target, formula, source, and eligibility rule before the event. If something must change, document why. Otherwise a shifting denominator can turn a weak result into a flattering percentage.
Event goals and objectives examples
The examples below are planning patterns, not benchmarks. Replace every blank with a value based on your baseline or a clearly labelled hypothesis.
1. Audience growth
Goal: grow a relevant audience. Objective: attract qualified registrants from a defined segment by registration close.
- Possible KPIs: qualified registrations; new-to-list registrants; registration-page conversion; partner-attributed registrations.
- Formula example: completed registrations ÷ unique registration-page visitors with usable tracking.
- Source boundary: HeySummit can support page, registration, referral, and traffic signals; your CRM or email platform owns list status and qualification.
- Decision: repeat the sources that produced relevant registrants, or change the audience, message, or partner mix.
2. Revenue and monetisation
Goal: earn revenue from the event. Objective: sell an agreed ticket or offer to an eligible audience within the sales window.
- Possible KPIs: paid ticket purchasers; gross ticket sales; refund-adjusted ticket sales; add-on uptake.
- Formula example: purchasers of an add-on ÷ purchasers eligible for that add-on.
- Source boundary: event ticket and sales reporting is not the same as settlement, tax, fees, refunds reconciliation, or net contribution. Finance and payment systems own those later figures.
- Decision: change the offer, ticket structure, pricing test, or channel investment.
Use the event ROI calculator when you need to model costs and value without calling gross ticket sales profit.
3. Education or skill change
Goal: help attendees understand or apply something. Objective: improve a defined measure of confidence, knowledge, or application for eligible participants.
- Possible KPIs: session completion; resource use; pre/post knowledge change; later application reported in a follow-up.
- Formula example: participants whose correct-answer score improved ÷ participants with matched pre- and post-responses.
- Source boundary: attendance may live in HeySummit or the delivery provider. A survey or learning tool owns knowledge evidence.
- Decision: revise the session, supporting material, practice activity, or follow-up.
Attendance shows that someone arrived. It does not prove that they learned or applied the material.
4. Community and relationship building
Goal: strengthen useful relationships. Objective: help a defined group take a specific follow-up action within an agreed period.
- Possible KPIs: relevant introductions completed; follow-up participation; repeat attendance; community activation.
- Formula example: new event attendees who complete the agreed community action within 14 days ÷ new attendees eligible for that action.
- Source boundary: registration and attendance are event outputs. The community platform or structured follow-up owns sustained participation.
- Decision: change the introduction format, invitation, moderation, or follow-up timing.
5. Sponsor or partner value
Goal: create credible value for a sponsor or partner. Objective: deliver agreed placements and measure defined audience actions without overstating commercial impact.
- Possible KPIs: partner-attributed registrations; opted-in actions; measurable sponsor-content interactions; agreed follow-up delivered.
- Formula example: attributed registrations ÷ registrations with usable source data.
- Source boundary: exposure, an attendee action, and downstream sponsor revenue are different claims. The latter may require the sponsor’s CRM or sales records.
- Decision: change the package, placement, offer, tracking method, or renewal conversation.
Define consent and attribution rules before the event. A sponsor should know what evidence they will receive and what the event data cannot prove.
6. Replay and on-demand value
Goal: extend the useful life of the event. Objective: help eligible attendees use relevant replay content within a defined access window.
- Possible KPIs: eligible viewers who start a replay; talk-level replay attendance; resource or CTA action; progression to a next offer.
- Formula example: eligible ticket holders who start at least one replay ÷ eligible ticket holders granted replay access.
- Source boundary: HeySummit can support current replay and content-attendance signals; CRM, offer, or payment outcomes may live elsewhere.
- Decision: change access length, packaging, reminders, topic selection, or the next offer.
Which source owns which event metric?
Choose one primary source for each KPI. Supporting systems can help explain differences, but forcing unlike timestamps, identities, and definitions to match perfectly often creates more confusion.
On a phone, swipe sideways to see every column in this table.
| Question | Example KPI | Primary source | Supporting source | What it cannot prove alone |
|---|---|---|---|---|
| Did the event page convert? | Registrations ÷ unique page visitors | HeySummit event reporting | Web analytics | Registrant quality or later customer value |
| What did ticket sales produce? | Refund-adjusted ticket sales | Payment or finance system | HeySummit sales reporting | Profit or net contribution without costs and fees |
| Who attended live? | Eligible attendees who joined | Delivery provider or event attendance record | HeySummit content reporting | Learning, satisfaction, or impact |
| Did the audience progress? | Qualified follow-up action | CRM or email platform | Registration/referral data | That the event caused the progression |
| Did knowledge change? | Matched pre/post improvement | Survey or learning tool | Attendance record | Long-term application |
| Did the community strengthen? | Defined participation within the window | Community system | Event attendance | Relationship quality or retention |
| Did the sponsor receive value? | Agreed placement or opted-in action | Event + sponsor tracking plan | Sponsor CRM | Revenue impact without sponsor-side evidence |
| Was replay useful? | Eligible viewers who started a replay | HeySummit content reporting | CRM or offer analytics | A downstream purchase or behaviour change |
HeySummit’s event reporting and analytics can support event-page and registration performance, attendees, ticket sales and revenue, referrals or traffic information, and current live or replay content insights where the account and integration expose them. Delivery-provider engagement, CRM lifecycle, surveys, finance reconciliation, community activity, and downstream sales may need their own source systems.
A worked small-team example
Imagine a small team planning a paid online summit. Its primary goal is qualified audience growth, with revenue and education as supporting outcomes. The team writes three rows and leaves the targets blank until it reviews its own baseline.
On a phone, swipe sideways to see every column in this table.
| Outcome | KPI | Target | Source and owner | Decision |
|---|---|---|---|---|
| Qualified audience growth | New-to-list qualified registrants ÷ registrants with known list status | Baseline or hypothesis: ___ by registration close | HeySummit + CRM; audience lead | Repeat or change the channel and message mix |
| Refund-adjusted ticket sales | Settled ticket receipts minus refunds in the agreed window | Baseline or hypothesis: ___ by finance close | HeySummit + payment/finance; finance owner | Revise ticket structure, offer, or acquisition spend |
| Learning confidence change | Matched participants reporting a defined improvement ÷ matched survey respondents | Baseline or hypothesis: ___ at follow-up | External survey; programme lead | Revise content, exercises, or follow-up |
The team can now see where handoffs matter. Event and registration data live in HeySummit, qualification lives in the CRM, settlement lives in finance, and learning evidence lives in the survey. One dashboard does not need to pretend it owns every outcome.
Review goals before, during, after, and later
Before the event
Freeze the definition, baseline, target, denominator, source, owner, consent rule, and data-availability date. Confirm that the source will actually collect what the plan asks for.
During the event
Monitor operational signals that allow useful action, such as registration issues, access problems, or weak attendance for a session. Do not rewrite the original goal to make current performance look better.
Immediately after
Reconcile registrations, attendance, ticket sales, refunds, replay access, and survey collection. Use a post-event report template to separate what happened from what the team thinks it means.
At the later outcome date
Review the results that need time: CRM progression, community participation, knowledge application, sponsor follow-up, or repeat purchases. If you need a broader framework for interpreting KPIs and ROI, use this guide to measure event marketing success.
Common event-goal mistakes and their fixes
- Too many goals: choose one primary goal and demote the rest to supporting outcomes.
- The objective is really a tactic: replace “send five emails” with the audience change those emails should support.
- The metric has no decision: write what below, on, or above target will change.
- The target came from an unrelated benchmark: use a comparable internal baseline or label the target as a hypothesis.
- The denominator changes: define eligibility, identity, and time window before collection begins.
- The source is unavailable: change the measure or assign access before the event.
- Gross sales are called profit: separate sales, refunds, fees, tax, costs, settlement, and net contribution.
- Attendance is called impact: collect evidence for the intended learning, relationship, or business outcome.
- Attribution is called causation: describe the method and other touchpoints that may have contributed.
- The dashboard is checked only afterward: schedule measurement and decision dates in the event plan.
Put the measurement plan into HeySummit and adjacent tools
Once the worksheet is clear, map each row to the event workflow. In HeySummit, that can include the event page, registration and ticket choices, referral or traffic information, attendee and sales reporting, and live or replay content insights where supported.
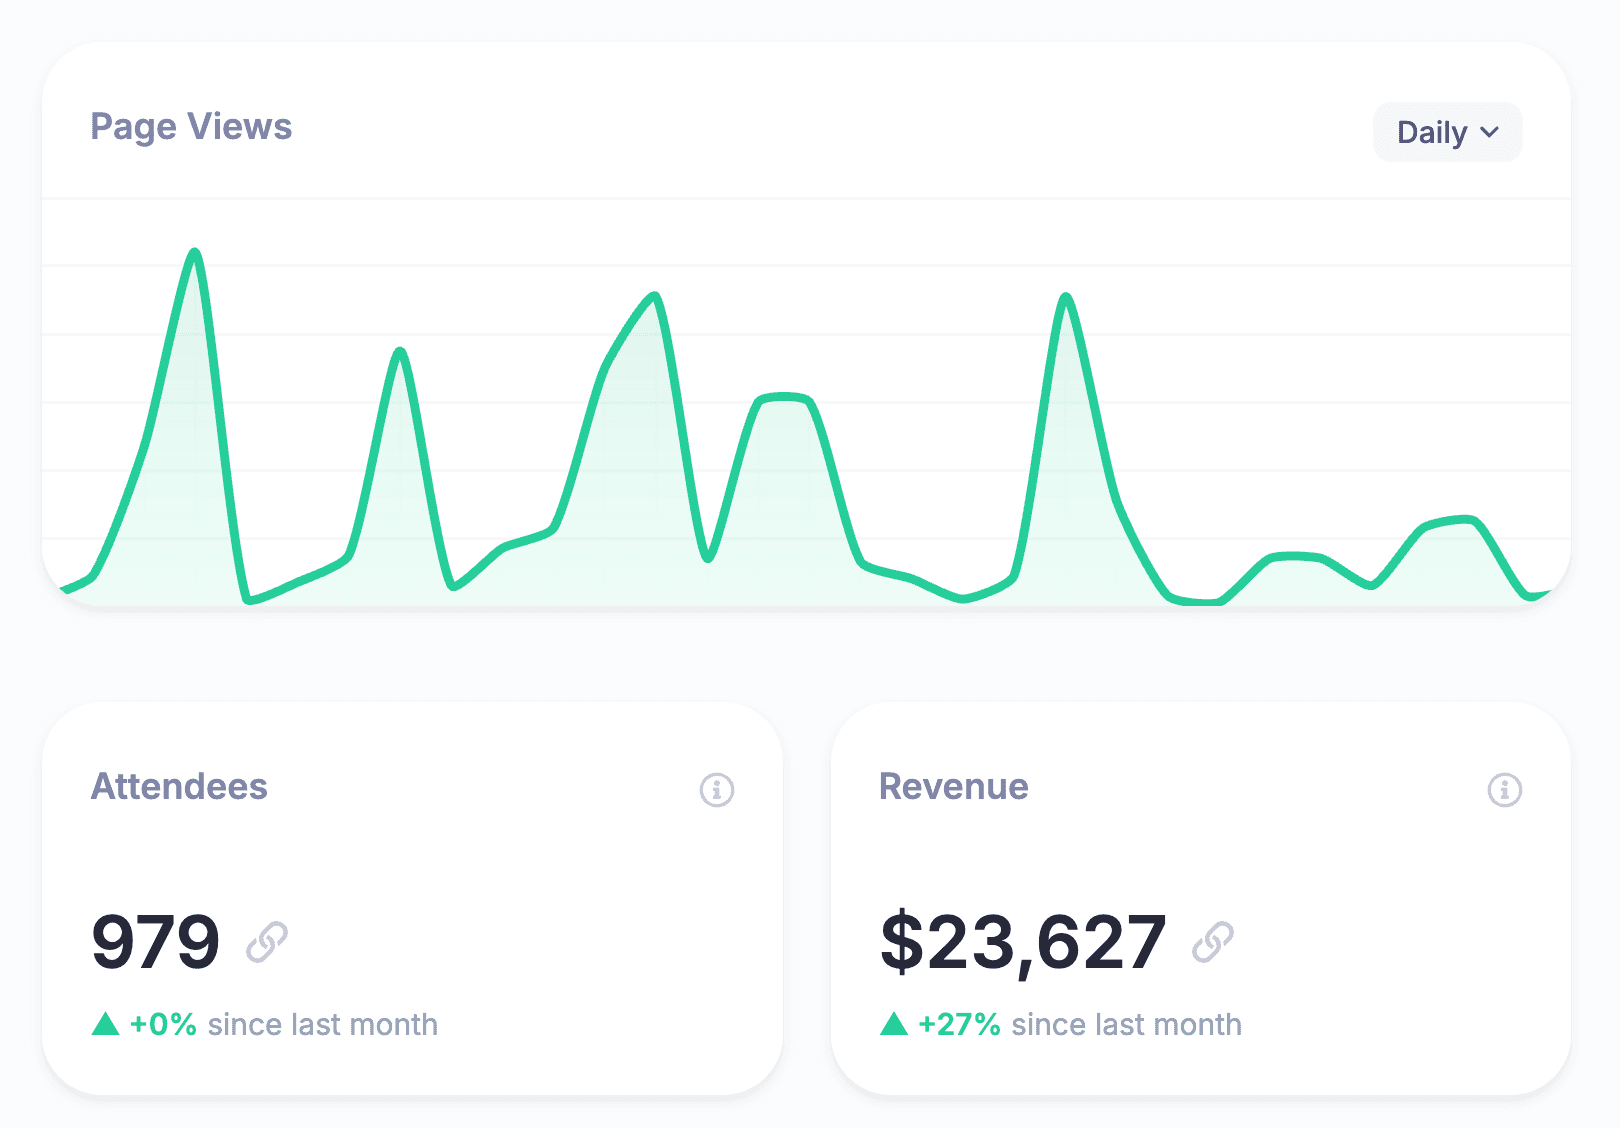
Keep adjacent owners explicit. Your video or streaming provider may own provider-specific duration, polls, or Q&A. Your CRM owns lifecycle and pipeline status. Surveys or learning tools own satisfaction and knowledge change. Finance owns fees, refunds, settlement, tax, and net revenue. Community and sales systems own their later outcomes.
That division is a strength, not a failure. A trustworthy plan says which system is authoritative for each question and where reconciliation is needed.
Choose one goal and make it operational
Copy the blank worksheet row. Choose one primary goal. Give every KPI an exact formula, baseline or hypothesis, time window, source, owner, and decision. Then add the collection and review dates to the event plan before you choose more tactics.
If you want to see how registration, ticketing, content, replays, and reporting fit into one event workflow, take the HeySummit product tour.
Frequently asked questions
Table of Contents
The event goal stack: goal, objective, KPI, metric, and targetStart with the decision, not the dashboardCopyable goal-to-KPI planning templateHow to choose a target without inventing a benchmarkEvent goals and objectives examplesWhich source owns which event metric?A worked small-team exampleReview goals before, during, after, and laterCommon event-goal mistakes and their fixesPut the measurement plan into HeySummit and adjacent toolsChoose one goal and make it operationalFrequently Asked QuestionsTry HeySummit free
HeySummit is the easiest way for creators and educators to grow their audience, authority and revenue with professional online events created in minutes, not weeks.
Share this article on:
Recent Posts
Loading feed...